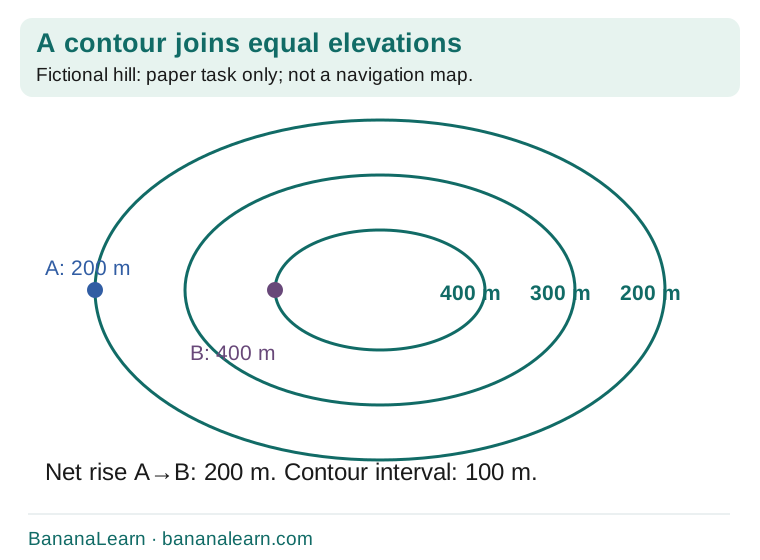
1. Point A is at 200 m and B at 400 m. Find the net rise.
- Subtract the elevations: 400−200.
- Net rise is 200 m.
- Do not report 400 m, which is B’s elevation rather than the change.
Maths · Suggested Classes 6–8
A short route across tightly packed contours can climb more sharply than a longer route. A map’s height labels and its distance scale answer different questions.
Start here
International Mountain Day is 11 December 2026. Use this original fictional contour-map challenge to compare elevation, climb, horizontal distance and average gradient.
Original BananaLearn guide · 7 November 2026
On a narrow screen, swipe the diagram or open it full size.
The UN designates 11 December as International Mountain Day. This 2026 resource uses that annual date for an independent map-reading lesson; no official 2026 theme is claimed.
Use the supplied fictional hill diagram and stated measurements. It is not a navigation map or advice for choosing a real hiking route. The task is to interpret contours and calculate with units.
A contour joins points at the same elevation above the map’s reference level. In the model, nested contours are labelled 200 m,300 m and 400 m. The contour interval is 100 m.
A contour is not a path, fence or step on the ground. A point between two contours has an elevation between their values unless additional information says otherwise; do not invent an exact height from the picture.
Point A is on the 200 m contour and B is on the 400 m contour. Their elevation difference is 400−200=200 m. That is not the same as either point’s elevation.
The total climb along a route can exceed the start-to-finish elevation difference if the route goes down and up. For the simple monotonic route in the worked task, climb equals the 200 m gain.
On a narrow screen, swipe the diagram or open it full size.
With the same contour interval and map scale, closer contours indicate that the elevation changes over a shorter horizontal distance: a steeper slope. Wider spacing suggests a gentler slope.
This is a local comparison. A route can pass through both steep and gentle sections. One average gradient does not describe every part of it.
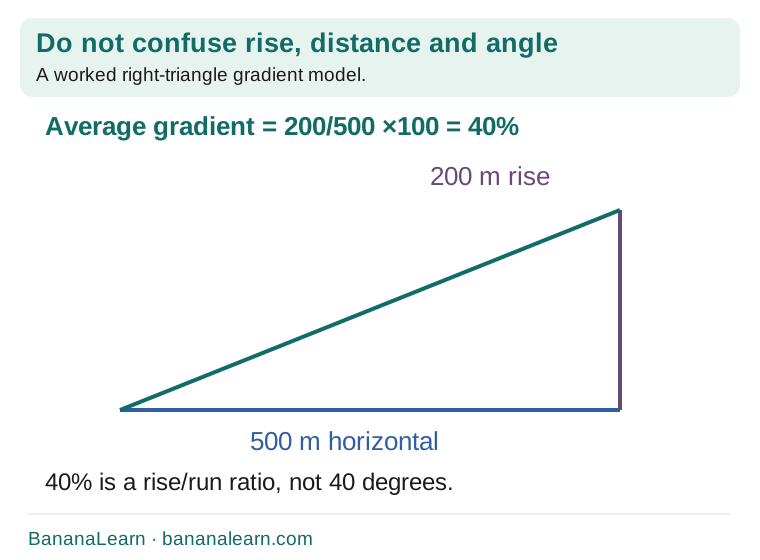
Suppose a separate task states scale 1:25,000 and a measured map route of 2 cm. Each centimetre represents 25,000 cm=250 m, so 2 cm represents 500 m horizontally.
Screen resizing changes the physical size of an illustration. Do not measure this online picture with a ruler and assume it retains that printed scale. Use the supplied 2 cm or a properly scaled printed map.
For a 200 m rise over 500 m horizontal distance, rise/run=200/500=0.4, or 40%. It may also be expressed as a rise:run ratio of 1:2.5. A percentage gradient is not an angle in degrees.
A second route with the same 200 m rise over 1000 m has average gradient 20%. The route’s surface distance would be different from its horizontal map distance; the calculation names which quantity it uses.
Write start and end elevations, net rise, stated horizontal distance, average gradient and the closest-contour section. If the route descends as well, include those changes when finding total ascent.
Keep a separate column for unknown information. A diagram may not provide terrain surface, obstacles, weather or a safe route. Those omissions prevent it from being a real-world route recommendation.
A useful explanation names the labelled contours and the distance calculation: “Both routes gain 200 m, but route X does so over 500 m and route Y over 1000 m; their average gradients are 40% and 20%.”
For an extension, redraw the hill with a 50 m interval and label the new lines. Keep elevation consistent while changing how much detail the map shows. The mountain observance provides a reason to investigate, but the map reasoning remains useful after the date.
See the reasoning
Try, explain, check
Try each task before opening its explanation. These are original BananaLearn questions, not official exam or past-paper questions. Where several answers can work, the explanation gives the criteria.
11 December 2026
The UN annual date is 11 December.
Points of equal elevation
It is not a walking path.
100 m
Adjacent labelled values differ by 100.
No
Its exact elevation is not supplied.
180 m
430−250=180.
No
Descending and climbing again can increase total ascent.
250 m
25,000 cm converts to 250 m.
1000 m
4×250=1000.
20%
100/500×100.
No
It is a rise/run percentage, not an angle.
A steeper local slope
The same elevation change occurs over less horizontal distance.
No
Essential terrain and safety information is absent.
Copy these headings and fill them for one worked task, then for a fresh attempt. Use your own evidence rather than copying the model answer.
Explore BananaLearn’s games, learning features and one-to-one tutoring. Maths is our priority; English and Science tutoring are also available. Bring a recent example of schoolwork when checking teaching fit.
Original BananaLearn explanations, examples, illustrations and practice. Source facts checked 7 November 2026. Suggested levels are learning guides, not a claim that every board or textbook uses the same sequence.
Event timing is calendar-backed. Search demand is a forecast unless a separately measured trend is stated. No official event theme, school programme or affiliation is implied.
How we prepare guides · Report a correction
Share the complete guide: https://bananalearn.com/learn/international-mountain-day-2026-contour-maps.html