Science · UK family activity; suggested Classes 4–8
National Tree Week 2026: A Leaf Observation Data Activity
Twelve of twenty observed leaves look mostly yellow. That is 60% of the sample—not proof that 60% of every leaf on the tree, or every tree in the park, is yellow.
Original BananaLearn guide · 2 November 2026
On a phone, swipe across the illustration to read every label.

Confirmed dates and location
The Tree Council gives 21–29 November for National Tree Week 2026 in the UK. These dates concern that campaign, not a universal international tree week. This is an independent BananaLearn observation activity, not official Tree Council material or a tree-planting instruction.
The activity connects observation, sampling, tallying and percentages. It can be completed indoors using the fictional data below or an adult-selected suitable image. Actual conditions vary by tree species, location and season; the activity does not assume all trees change colour together.
Choose an observation method before counting
If using a real tree, an adult selects a suitable accessible viewing point and agrees the activity’s boundaries. Observe without climbing, pulling branches or collecting unknown material. A view from a window or an appropriate owned photograph can be enough.
Define a sample, such as twenty clearly visible leaves in one selected part of the view. Decide how mixed-colour leaves will be classified, for example by predominant visible colour, and keep that rule consistent. A sample is not automatically a random or complete census.
Use the original fictional tally
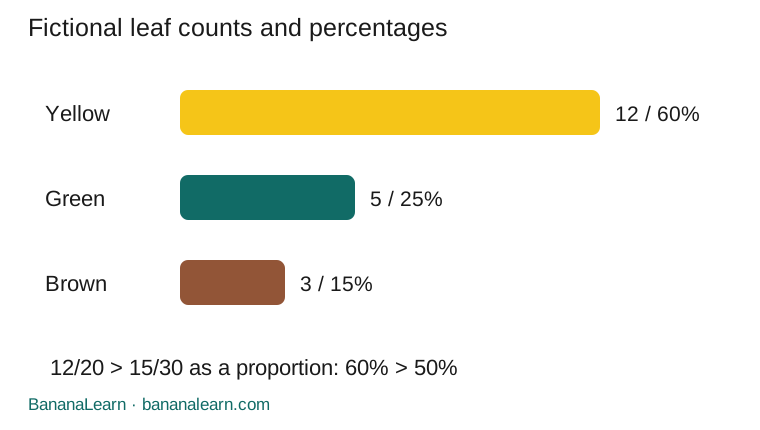
Imagine a sample of twenty leaves: twelve mostly yellow, five mostly green and three mostly brown. These are invented teaching numbers, not a real survey. Check the total: 12+5+3=20. The categories refer to this agreed observation rule, not a botanical diagnosis.
The proportions are 12/20=60%, 5/20=25% and 3/20=15%. They sum to 100%. A bar chart can show the counts, while a sentence should keep the word sample visible so readers know what was actually counted.
On a phone, swipe across the illustration to read every label.
What the sample can and cannot establish
A supported statement is Most of the twenty leaves in this fictional sample were classified as mostly yellow. An unsupported statement is Most leaves on every tree nearby are yellow. The larger claim requires a much broader and suitably selected observation plan.
The sample may favour leaves in bright light, one branch or an easier-to-see colour. Some leaves may be hidden. Naming these limits is not a reason to discard the activity; it is part of interpreting the information honestly.
Repeat the view to investigate change
For a real observation series, record the date, viewing point, weather-related visibility and classification rule. Revisit the same defined view where practical. If the sample size changes, compare proportions carefully instead of treating the raw count alone as the change.
For example, twelve yellow leaves out of twenty is 60%, while fifteen out of thirty is 50%. The count rose but the proportion fell. These numbers are another fictional example. A child can explain the difference with fraction bars before calculating percentages.
Do not diagnose a tree from a colour count
Leaf colour alone does not establish tree health, species or the cause of a change. Age, season, species, light and other conditions can matter. If the identity is unknown, label it Tree A rather than inventing a species name.
For a school investigation, ask which additional observation would help answer the chosen question. A repeated fixed-view record addresses visible change more directly than one dramatic photograph. Professional questions about hazards or disease require an appropriate adult or specialist process, not this worksheet.
Run a 30-minute paper activity
Use 5 minutes to define the sample and categories, 8 to tally and calculate, 7 to draw a labelled chart, 5 to write a supported conclusion and 5 to name a limitation and next observation. Adjust for the learner’s age and the actual school task.
For younger learners, work with counts and half or quarter comparisons. For older learners, compare two sample sizes or discuss selection bias. The complete fictional dataset is enough to practise the reasoning without an outdoor trip or downloaded campaign pack.
Make a shareable result with the evidence attached
A useful caption says Fictional twenty-leaf sample: 12 mostly yellow, 5 green, 3 brown; categories based on predominant visible colour. The chart does not represent every tree. Keep the dataset and limitation beside the picture when sharing it.
The record below supports a real or paper observation. The Tree Council source verifies the 2026 dates, not the invented counts. Related sampling and plant guides explain how a small observation can lead to a better question without making a claim larger than the evidence.
Leaf observation record
Copy this record into a notebook. Fill each blank using your own example or the activity above.
On a phone, swipe across a wide table to see every column.
| Category / check | Count | Fraction / note |
|---|---|---|
| Mostly yellow | 12 of 20 fictional leaves | ___ |
| Mostly green | 5 of 20 | ___ |
| Mostly brown | 3 of 20 | ___ |
| Sample selection and date | ___ | ___ |
| Supported conclusion and limit | ___ | ___ |
10 questions with explained answers
Try each question first. Open the explanation to check your reasoning. These are original BananaLearn questions, not official exam questions.
What dates does the Tree Council give for the UK’s 2026 campaign?
Check answer and reasoning
21–29 November.
Use the organiser’s current edition rather than an old annual calendar.What is the total in the fictional sample?
Check answer and reasoning
20 leaves.
12+5+3=20.What percentage are mostly yellow?
Check answer and reasoning
60%.
12÷20×100=60.What percentage are mostly green?
Check answer and reasoning
25%.
5÷20×100=25.What percentage are mostly brown?
Check answer and reasoning
15%.
3÷20×100=15.Do the three percentages sum to 100?
Check answer and reasoning
Yes.
60+25+15=100.Can these counts establish the colour of every tree in a park?
Check answer and reasoning
No.
The evidence concerns one limited fictional sample.Compare 12/20 with 15/30.
Check answer and reasoning
60% versus 50%.
The larger raw count belongs to the smaller proportion in this comparison.What should be done if the tree species is unknown?
Check answer and reasoning
Use a neutral identifier such as Tree A.
Do not infer a species without suitable evidence.Name a useful repeat-observation record.
Check answer and reasoning
For example, date, fixed view and classification rule.
Consistency helps interpret change.
Choose your next learning step
Explore BananaLearn games, learning resources and tutoring. Maths is our priority; English and Science tutoring are also available. Share your current schoolwork when checking teaching fit.
Sources and scope
Explanations, activities, diagrams and practice are original BananaLearn work. Class labels suggest a learning level; school sequences and current textbook editions can differ. Sources checked 2 November 2026.
How we prepare guides · Report a correction
Share the complete guide: https://bananalearn.com/learn/national-tree-week-2026-leaf-data-activity.html