What does it mean?
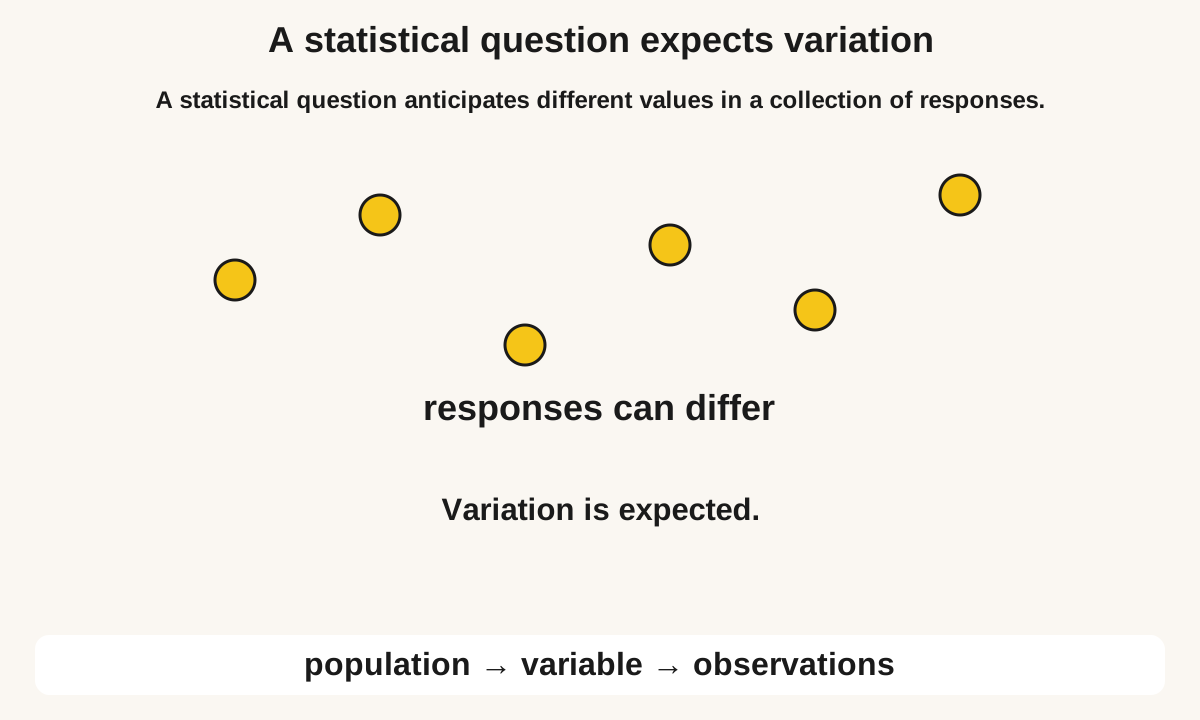
A statistical question expects variation in a set of observations. “How many sides does a hexagon have?” asks for a fixed fact. “How many minutes did these pupils read yesterday?” can produce different values that need summarising. The population is the group of interest; a sample is the subset actually observed.
A statistical question is one whose answer varies across a group and needs data. "How many minutes are in an hour?" is not statistical: the answer is a single fact. "How many minutes do Grade 8 students in this school take to travel in?" is statistical: travel times differ. The population is everyone you want to know about. A sample is the people you actually record. A sample is biased if some groups are systematically more likely to be chosen, for example asking only the football team about favourite sports. Numerical data are counts or measurements. Categorical data are labels such as sport or colour. The choice rows show that a question can have several possible answers; a statistical question expects that spread.
Learning goal: Form statistical questions; recognise population, sample, bias and data type. The grade is a suggested starting point; school sequences vary. Use the first worked example to check readiness, and Grade 6 data handling: tally marks and bar graph questions if an earlier idea needs revisiting.
See the idea
Read each diagram with its labels, then follow the worked examples. Practice questions include their own measurements and information.
Enlarge diagram to read the labels
Swipe across the enlarged diagram to read every label.

Enlarge diagram to read the labels
Swipe across the enlarged diagram to read every label.
Choose a method and explain why it works
Define the population, variable, units and time period before collecting data. Use a selection method that gives the relevant population a fair opportunity to be included. Record non-responses as well as responses. A random draw can reduce selection bias, though it does not guarantee a perfectly representative sample.
Notation: Population: whole group of interest. Sample: the recorded subset. Bias: a systematic tilt in who is chosen or how they are asked.
Key rule and when to use it
The population is the complete group of interest; the sample is the observed subset. A statistical question anticipates variation across observations.
Worked examples, step by step
Example 1: Which is a statistical question: "What colour is the school badge?" or "What badge colour do Grade 8 students prefer?" Explain.
- A statistical question expects a distribution of answers, not one official fact.
- The badge has one colour, so the first question is not statistical.
- Preferences can differ, so the second question is statistical. The population would be Grade 8 students at that school.
Answer: The preference question is statistical
Check: If every student must give the same answer, the question is not statistical.
Example 2: A researcher wants the typical travel time of all 400 Grade 8 students in a town. They record times from 20 students waiting at one bus stop. Name the population, the sample, and one bias.
- This is not about whether the question is statistical. It already is. Now separate population from sample.
- Population: all 400 Grade 8 students in the town. Sample: the 20 students at that bus stop.
- Bias: this bus-stop sample excludes walkers, other stops and other travel modes, so it may misrepresent the population’s travel-time distribution.
Answer: Population 400 Grade 8 students; sample 20 at one bus stop; bus users over-represented
Check: Twenty is a sample, not the population. A single location is a convenience sample.
Example 3: A school surveys only its football club about the favourite sport of all pupils. Name the problem and suggest an improvement.
- The population is all pupils, but the selected group already participates in one sport.
- This selection may over-represent football preferences.
- Draw pupils from complete school lists, with appropriate coverage of year groups, and use the same neutral question.
Common mistakes and important boundaries
A large sample can still be biased if it systematically misses groups. Asking only at one bus stop excludes walkers and other routes; it does not establish whether the true typical travel time is higher or lower. Leading wording and non-response can introduce bias after selection too.
A point to explain
A learner may call any survey statistical, or treat a convenience group as the whole population.
Compare an uncertain attempt with the closest worked example. Look at the meaning of each operation, unit and label before repeating the arithmetic.
Statistical Questions, Populations and Samples — practice
Work on paper first. Open each answer afterwards and compare the reasoning. Print the questions with or without the separate answer key; no account is required.
Name: ____________________ Date: __________
Which question is statistical?
Answer and a way to check
How many books did Grade 8 students in this class read last month?
Ask whether different people could give different numerical answers that you would then summarise.
Favourite sport of all Grade 8 students in a school is the research aim. Which sample is least biased?
Answer and a way to check
Ask 40 students chosen from the full class lists using a random draw.
Every Grade 8 student should have a similar chance of being asked. Sport clubs are not the whole school.
Is "How many hours do Grade 8 students in this school sleep on a school night?" a statistical question? Answer yes or no.
Answer and a way to check
yes
Different students can sleep different numbers of hours. That spread makes it statistical.
A town has 500 Grade 8 students. A study records travel mode for 40 of them. What is the sample size?
Answer and a way to check
40
The sample is the number of records taken, not the size of the whole year group.
Is "favourite fruit" categorical or numerical? Write one word.
Answer and a way to check
categorical
Fruit names are labels, not measurements. Numerical data are counts or measured amounts.
Why is asking only students in the library after school a biased sample of "time spent on homework" for the whole Grade 8 year?
Answer and a way to check
It systematically excludes pupils who do not use the after-school library; their homework times may differ.
Ask who is missing from the library. Those students may do less homework.
A student says "How many sides does a hexagon have?" is statistical because you might survey people. What is the mistake?
Answer and a way to check
The number of sides is a fixed fact, so answers should not form a distribution.
If every correct answer must be the same number, the question is not statistical.
Write one statistical question about reading time for Grade 8 students at a school. Then name a biased sample for that question.
Answer and a way to check
How many minutes did Grade 8 students at this school read last night?; asking only the library club
The question must allow different times. The biased sample should be a group already likely to read more or less.
Statistical Questions, Populations and Samples — answer key
How many books did Grade 8 students in this class read last month? Ask whether different people could give different numerical answers that you would then summarise.
Ask 40 students chosen from the full class lists using a random draw. Every Grade 8 student should have a similar chance of being asked. Sport clubs are not the whole school.
yes Different students can sleep different numbers of hours. That spread makes it statistical.
40 The sample is the number of records taken, not the size of the whole year group.
categorical Fruit names are labels, not measurements. Numerical data are counts or measured amounts.
It systematically excludes pupils who do not use the after-school library; their homework times may differ. Ask who is missing from the library. Those students may do less homework.
The number of sides is a fixed fact, so answers should not form a distribution. If every correct answer must be the same number, the question is not statistical.
How many minutes did Grade 8 students at this school read last night?; asking only the library club The question must allow different times. The biased sample should be a group already likely to read more or less.
Questions students and parents ask
Does a large sample automatically remove bias?
No. Thousands of responses from one unrepresentative group can still misrepresent the population. Who can be selected matters as well as how many people are selected.
Does a random sample eliminate every bias?
No. Question wording, measurement errors and different response rates can still affect results. Describe both how people were selected and how the data were collected.
Is this a complete set of textbook exercise solutions?
No. This guide adapts BananaLearn’s own teaching examples and practice. It is not official NCERT material or a promise of the exact chapter sequence in a particular board, country or textbook edition.
What if the examples are still difficult?
Revisit Grade 6 data handling: tally marks and bar graph questions. Try the first example with its model, then attempt one fresh question independently. A correct copied answer is not evidence that the method can be used without support.
Help at home
Ask “Who is missing?” and “What exactly was measured?” These often reveal a sampling problem more clearly than memorising a definition.
Keep one example of the learner’s own working. A repeated difficulty across fresh questions can guide a discussion with their teacher; one short practice sheet does not establish a diagnosis or a full mastery profile.
Connect this idea to the next skill
About this guide
Based on BananaLearn’s Grade 8 course lesson “Ask a Question That Can Vary”. The explanations have been adapted for independent reading; course diagrams are reused where they fit the idea, and missing classroom givens are made explicit in questions.
Need another way to understand it?
Bring one question your child found difficult to a free 50-minute session. Tell us their grade, curriculum and time zone so we can discuss a suitable next step.
Request a free session