What does it mean?
A frequency counts observations, not the size of a measurement. If twelve pupils score in the 30–40 interval, twelve is a count of pupils, not a score of twelve. Grouping reduces detail: you know each value’s interval, but not its exact position within it.
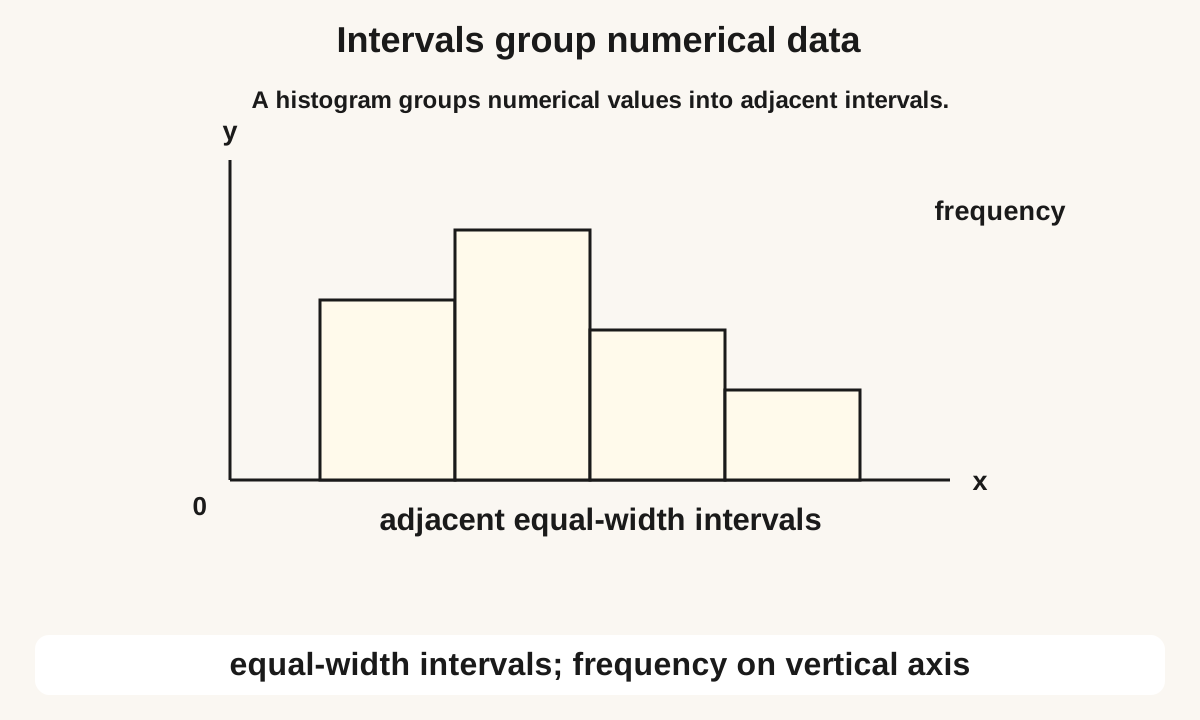
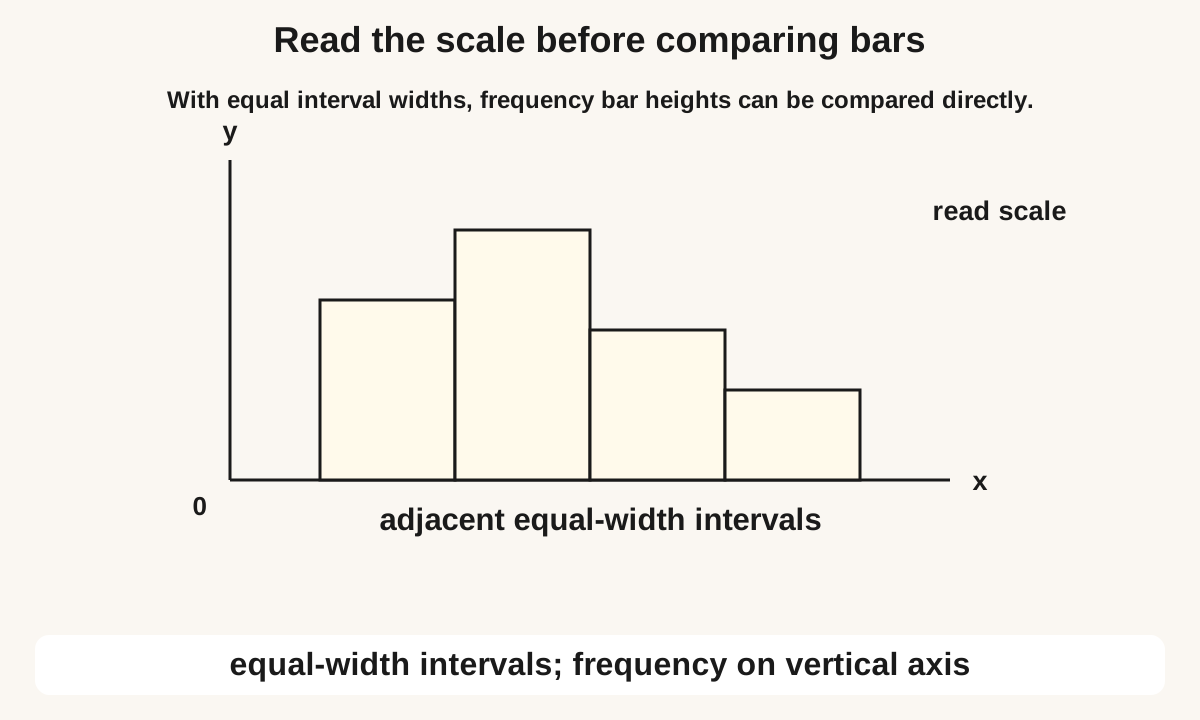
A frequency table counts how many data values fall in each class. For grouped numerical data, classes such as 10–20, 20–30 must not overlap in the counting rule used in the table. This guide uses equal class widths. A histogram with equal widths has bar height equal to frequency. The modal class is the class with the greatest frequency, so the tallest bar. The total number of observations n is the sum of the frequencies. To interpret, name the class interval, read its frequency, and say what that means in context. Do not draw conclusions from a sketch that is not the given histogram. Class width is the difference between consecutive lower limits, for example 10.
Learning goal: Build and interpret frequency tables, histograms and suitable displays. The grade is a suggested starting point; school sequences vary. Use the first worked example to check readiness, and Grade 6 data handling: tally marks and bar graph questions if an earlier idea needs revisiting.
See the idea
Read each diagram with its labels, then follow the worked examples. Practice questions include their own measurements and information.
Enlarge diagram to read the labels
Swipe across the enlarged diagram to read every label.
Enlarge diagram to read the labels
Swipe across the enlarged diagram to read every label.
Choose a method and explain why it works
Use a consistent boundary rule such as 10 ≤ x < 20, then 20 ≤ x < 30. A value of 20 belongs in the second class only. Add frequencies for the total count. This guide uses equal-width histograms with frequency on the vertical axis, so the tallest bar identifies the modal class.
Notation: Class width = upper start − lower start of that class. Modal class = greatest frequency. n = sum of frequencies.
Key rule and when to use it
For the equal-width classes used here, bar height gives class frequency. Use a boundary convention such as 10 ≤ x < 20 so an observation is counted once.
Make class boundaries unambiguous
Read 10–20 here as 10 ≤ x < 20, followed by 20 ≤ x < 30. A score of exactly 20 belongs to the second class, never both. A score of 19.5 belongs to the first. If a data set includes its largest boundary value, state whether the last class includes that endpoint.
For frequencies 5, 8, 12, 7 and 3 in successive width-10 classes starting at 10, the total is 35. The modal class is 30 ≤ x < 40 because its frequency is 12. This does not identify a most common exact mark, nor does 12 out of 35 form a majority.
Worked examples, step by step
Example 1: Marks use classes 10–20, 20–30, 30–40, 40–50, 50–60 with frequencies 5, 8, 12, 7, 3. Find n and the modal class.
- n = 5 + 8 + 12 + 7 + 3 = 35.
- The greatest frequency is 12, in class 30–40. That is the modal class.
- On an equal-width histogram the 30–40 bar is the tallest. Height 12 means 12 students, not a mark of 12.
Answer: n = 35; modal class 30–40
Check: 35 people is the whole sample. The middle class is the most common, not the last class.
Example 2: Marks use classes 10 ≤ x < 20, 20 ≤ x < 30, 30 ≤ x < 40, 40 ≤ x < 50 and 50 ≤ x < 60, with frequencies 5, 8, 12, 7 and 3. How many students scored under 30, and what is the class width?
- This is not "find the mode". Add the frequencies of classes that lie wholly under 30.
- 10–20 and 20–30: 5 + 8 = 13 students scored under 30.
- Class width is 10 marks. Ignoring width would mix 10–20 with a different grouping.
Answer: 13; 10 marks
Check: 13 is less than 35, and two of five classes were added, which matches the left side of the histogram.
Example 3: Use classes 0 ≤ x < 10, 10 ≤ x < 20 and 20 ≤ x < 30 for values 4, 10, 10, 16 and 25. Find the frequencies.
- 4 goes into the first class. Both 10s and 16 go into the second. 25 goes into the third.
- The frequencies are 1, 3 and 1; total 5.
- The modal class is 10 ≤ x < 20. Neither 10 is counted twice.
Common mistakes and important boundaries
For unequal class widths, frequency bar heights alone are not a fair comparison; frequency density is needed, beyond this guide’s model. The modal class is the class with the largest count, not necessarily a majority of all observations. A grouped table usually cannot give the exact mean without the original values.
A point to explain
A learner may read the midpoint as the frequency, ignore class width, or treat bar area rules for unequal widths that are not taught here.
Compare an uncertain attempt with the closest worked example. Look at the meaning of each operation, unit and label before repeating the arithmetic.
Frequency Tables and Equal-Width Histograms — practice
Work on paper first. Open each answer afterwards and compare the reasoning. Print the questions with or without the separate answer key; no account is required.
Name: ____________________ Date: __________
On an equal-width histogram, what does the height of a bar represent?
Answer and a way to check
The frequency of that class.
Equal widths mean you may read height as how many values fell in that class.
Frequencies 4, 9, 5, 2 on classes starting at 10 with width 10. Which is the modal class?
Answer and a way to check
20–30
Find the largest frequency, then name that class interval.
Frequencies 6, 10, 8, 4. What is n?
Answer and a way to check
28
Add 6, 10, 8 and 4. Do not multiply by class width.
Classes start at 0 with width 10. Frequencies 3, 5, 11, 6. How many values are in 20–30?
Answer and a way to check
11
Classes are 0–10, 10–20, 20–30, 30–40. 20–30 is the third frequency.
Classes start at 10 with width 10. What class width is being used?
Answer and a way to check
10
Width is the step from one lower limit to the next, not a frequency.
Frequencies 2, 7, 9, 4 on equal-width classes 0–10 to 30–40. A student says most people scored 9. What should they have said instead?
Answer and a way to check
9 is a frequency, not a score. The largest group is the 20–30 class.
Nine out of 22 is the largest class count, but not more than half the observations. Say modal class or largest group rather than claiming a majority.
Equal-width histogram frequencies 5, 8, 12, 7, 3. A student says the modal class is 50–60 because that bar is on the right. What is the mistake?
Answer and a way to check
The modal class is the tallest bar, frequency 12, not the rightmost bar.
Compare bar heights. The greatest frequency names the modal class.
Travel times (min): classes 0–10, 10–20, 20–30, 30–40 with frequencies 6, 11, 8, 3. How many students took less than 20 minutes, and what is the modal class?
Answer and a way to check
17; 10–20
Less than 20 minutes is the first two classes. The modal class has frequency 11.
Frequency Tables and Equal-Width Histograms — answer key
The frequency of that class. Equal widths mean you may read height as how many values fell in that class.
20–30 Find the largest frequency, then name that class interval.
28 Add 6, 10, 8 and 4. Do not multiply by class width.
11 Classes are 0–10, 10–20, 20–30, 30–40. 20–30 is the third frequency.
10 Width is the step from one lower limit to the next, not a frequency.
9 is a frequency, not a score. The largest group is the 20–30 class. Nine out of 22 is the largest class count, but not more than half the observations. Say modal class or largest group rather than claiming a majority.
The modal class is the tallest bar, frequency 12, not the rightmost bar. Compare bar heights. The greatest frequency names the modal class.
17; 10–20 Less than 20 minutes is the first two classes. The modal class has frequency 11.
Questions students and parents ask
What if histogram class widths differ?
Frequency alone is no longer a comparable height. Use frequency density = frequency ÷ class width so bar area represents frequency. The examples here deliberately use equal widths.
Do histogram bars touch?
Bars for adjacent numerical intervals meet because the intervals share a boundary. A zero-frequency interval still occupies its place on the numerical axis.
Is this a complete set of textbook exercise solutions?
No. This guide adapts BananaLearn’s own teaching examples and practice. It is not official NCERT material or a promise of the exact chapter sequence in a particular board, country or textbook edition.
What if the examples are still difficult?
Revisit Grade 6 data handling: tally marks and bar graph questions. Try the first example with its model, then attempt one fresh question independently. A correct copied answer is not evidence that the method can be used without support.
Help at home
Ask the learner to place a value exactly on a boundary. Then ask whether the bar’s height names a measured value or the number of observations.
Keep one example of the learner’s own working. A repeated difficulty across fresh questions can guide a discussion with their teacher; one short practice sheet does not establish a diagnosis or a full mastery profile.
Connect this idea to the next skill
About this guide
Based on BananaLearn’s Grade 8 course lesson “From Tally to Histogram”. The explanations have been adapted for independent reading; course diagrams are reused where they fit the idea, and missing classroom givens are made explicit in questions.
Need another way to understand it?
Bring one question your child found difficult to a free 50-minute session. Tell us their grade, curriculum and time zone so we can discuss a suitable next step.
Request a free session