What does it mean?
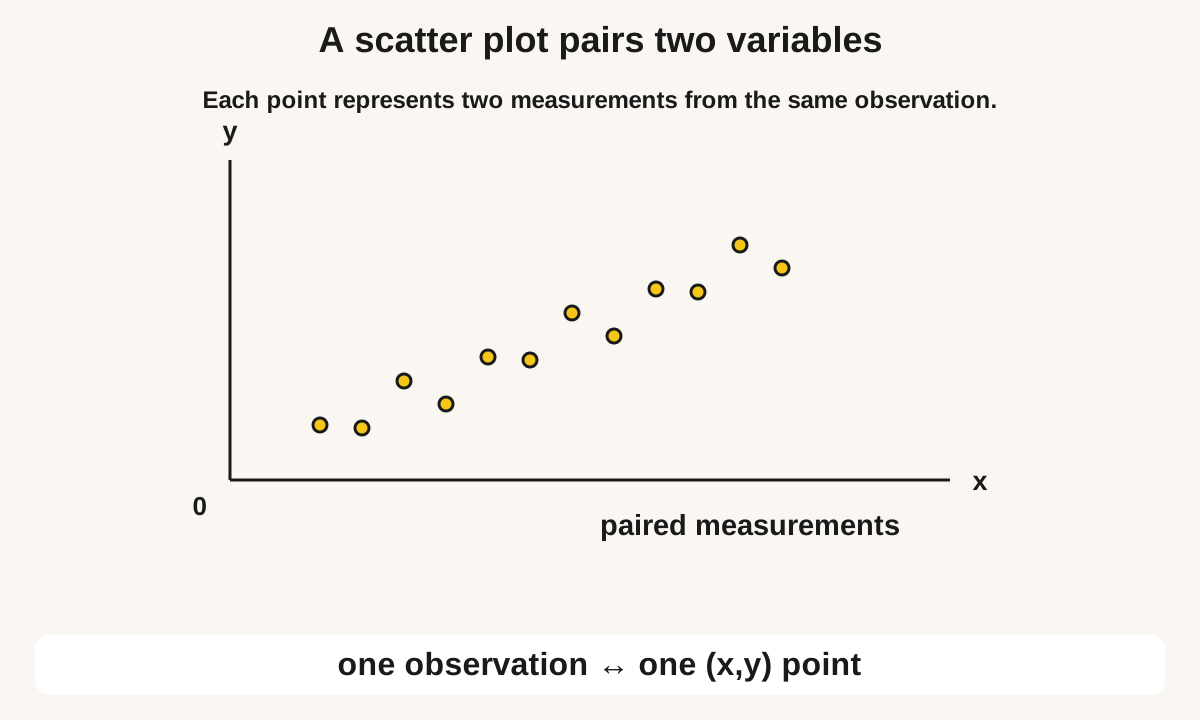
A scatter plot pairs two measurements from each observation. Its cloud can suggest positive association, negative association or no clear trend. One point is a pair belonging to the same observation; pairing unrelated x-values and y-values would create a misleading plot.
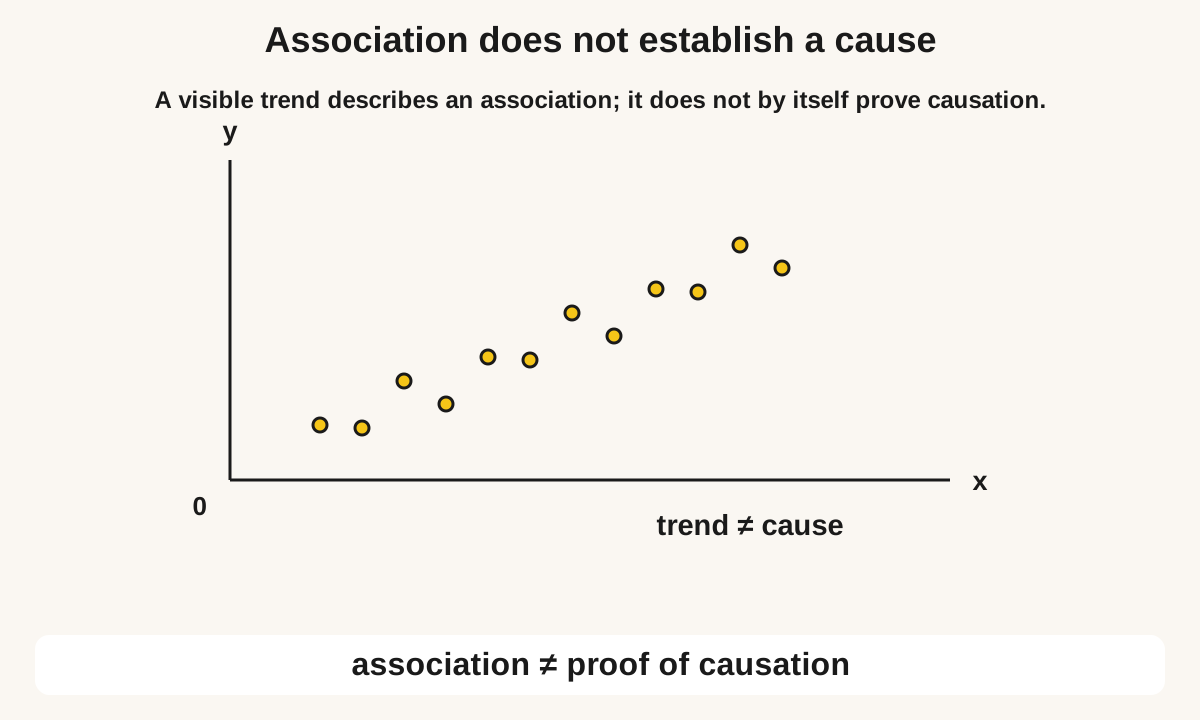
Each plotted point is a pair (x, y). If y tends to increase as x increases, the association is positive. If y tends to decrease as x increases, the association is negative. If the cloud has no tilt, there is no clear association. An informal line of fit follows the middle of the cloud; it does not have to pass through every point. An outlier is a point far from the cloud. Association is not causation: a third factor, or chance, may sit behind both variables. Read the axis labels. Compare with the three type diagrams: positive, negative, and none.
Learning goal: Interpret scatter plots, association, outliers and informal lines of fit. The grade is a suggested starting point; school sequences vary. Use the first worked example to check readiness, and Grade 6 data handling: tally marks and bar graph questions if an earlier idea needs revisiting.
See the idea
Read each diagram with its labels, then follow the worked examples. Practice questions include their own measurements and information.
Enlarge diagram to read the labels
Swipe across the enlarged diagram to read every label.
Enlarge diagram to read the labels
Swipe across the enlarged diagram to read every label.
Choose a method and explain why it works
Read both axis labels and units. Describe the main direction and how closely points cluster around it. Identify unusual points separately. An informal line of fit follows the main pattern rather than joining points in order. Use it cautiously for an estimate within the observed range.
Notation: Positive association: cloud rises to the right. Negative: cloud falls to the right. Outlier: a point far from the cloud.
Key rule and when to use it
Each scatter point pairs two measurements from the same observation. Describe the trend and unusual points; association alone does not establish a cause.
Worked examples, step by step
Example 1: Hours of practice 1 to 8 pair with scores 22, 26, 31, 34, 42, 45, 52, 58. Describe the association and say whether you may conclude that extra practice causes a higher score.
- As hours increase, scores tend to increase, so the association is positive.
- An informal line of fit would rise to the right through the cloud.
- You may not conclude causation. Other factors, such as prior knowledge, could sit behind both hours and scores.
Answer: positive association; no, not causation
Check: Every later point is higher than the early ones, so a rising cloud is fair. Cause is a stronger claim than the plot supports.
Example 2: A scatter plot of temperature against heating use falls to the right, except for one high-temperature, high-heating point. Name the association and the outlier.
- This is a negative association: heating use tends to fall as temperature rises.
- The odd day (high temperature and high heating) does not follow the falling cloud, so it is an outlier.
- Do not drag the line of fit through that one day. The line should follow the main cloud.
Answer: negative association; the high-temperature high-heating day is an outlier
Check: Heating usually drops in warmer weather, so a falling cloud is expected. One opposite day is not the trend.
Example 3: Points are (1, 4), (2, 6), (3, 8) and (4, 10). Describe a fitting rule and predict y at x = 2.5.
- The points increase by 2 in y for each increase of 1 in x.
- They fit y = 2x + 2. For x = 2.5, the rule gives y = 7.
- This is interpolation between observed inputs. A context still determines whether fractional inputs and the linear model make sense.
Common mistakes and important boundaries
Association does not establish cause. Temperature might affect both ice-cream sales and sunglasses sales. Extrapolating far beyond the observed x-range assumes the pattern continues, which may fail. No clear straight-line trend does not rule out every possible relationship: a curved pattern can also occur.
A point to explain
A learner may say one variable causes the other, or force a line through an outlier, or name association from a single point.
Compare an uncertain attempt with the closest worked example. Look at the meaning of each operation, unit and label before repeating the arithmetic.
Scatter Plots and Correlation — practice
Work on paper first. Open each answer afterwards and compare the reasoning. Print the questions with or without the separate answer key; no account is required.
Name: ____________________ Date: __________
What does a positive association mean on a scatter plot?
Answer and a way to check
y tends to increase as x increases.
Look at the cloud as x grows. If y tends to grow too, the association is positive.
The scatter of hours versus score rises to the right. Which type is this?
Answer and a way to check
Positive association
As hours increase, scores increase. That is a positive association.
A scatter of speed against travel time falls to the right. Write positive, negative, or none.
Answer and a way to check
negative
If y tends to fall as x rises, the association is negative.
Points (1, 20), (2, 21), (3, 19), (4, 50), (5, 22). Which x-value looks like an outlier?
Answer and a way to check
4
Four of the y-values sit near 20. Find the pair that does not.
Shoe size against reading score shows a shapeless cloud. Write positive, negative, or none.
Answer and a way to check
none
If the points do not rise or fall as a cloud, there is no clear association.
Ice-cream sales and sunglasses sales both rise in the same weeks. Why must you not conclude that ice-cream sales cause sunglasses sales?
Answer and a way to check
Association is not causation. A third factor, such as warmer weather, can raise both sales.
Name a third variable that could move both. The scatter only shows they rise together.
A student draws the line of fit through one outlier far above the cloud and ignores the other points. What is the mistake?
Answer and a way to check
The line of fit should follow the main cloud, not one far point.
Cover the far point with a finger. The remaining cloud is the trend the line should follow.
Hours of sleep 5, 6, 7, 8, 9 pair with reaction times 0.42, 0.38, 0.33, 0.30, 0.28. Describe the association, then say whether less sleep is proved to cause slower reactions.
Answer and a way to check
negative association; no
As sleep increases, reaction time decreases, so the association is negative. Cause still needs more than a scatter.
Scatter Plots and Correlation — answer key
y tends to increase as x increases. Look at the cloud as x grows. If y tends to grow too, the association is positive.
Positive association As hours increase, scores increase. That is a positive association.
negative If y tends to fall as x rises, the association is negative.
4 Four of the y-values sit near 20. Find the pair that does not.
none If the points do not rise or fall as a cloud, there is no clear association.
Association is not causation. A third factor, such as warmer weather, can raise both sales. Name a third variable that could move both. The scatter only shows they rise together.
The line of fit should follow the main cloud, not one far point. Cover the far point with a finger. The remaining cloud is the trend the line should follow.
negative association; no As sleep increases, reaction time decreases, so the association is negative. Cause still needs more than a scatter.
Questions students and parents ask
Does no linear correlation mean no relationship at all?
No. A curved pattern can have little linear correlation while still showing a clear relationship. Look at the full plot rather than only a single trend label.
Must a line of fit pass through every point?
No. It describes a trend through a cloud, often balancing points above and below. A perfect straight-line dataset is a special case.
Is this a complete set of textbook exercise solutions?
No. This guide adapts BananaLearn’s own teaching examples and practice. It is not official NCERT material or a promise of the exact chapter sequence in a particular board, country or textbook edition.
What if the examples are still difficult?
Revisit Grade 6 data handling: tally marks and bar graph questions. Try the first example with its model, then attempt one fresh question independently. A correct copied answer is not evidence that the method can be used without support.
Help at home
Ask for a description before a prediction. Have the learner name one alternative explanation before making any causal claim.
Keep one example of the learner’s own working. A repeated difficulty across fresh questions can guide a discussion with their teacher; one short practice sheet does not establish a diagnosis or a full mastery profile.
Connect this idea to the next skill
About this guide
Based on BananaLearn’s Grade 8 course lesson “Two Variables on a Cloud”. The explanations have been adapted for independent reading; course diagrams are reused where they fit the idea, and missing classroom givens are made explicit in questions.
Need another way to understand it?
Bring one question your child found difficult to a free 50-minute session. Tell us their grade, curriculum and time zone so we can discuss a suitable next step.
Request a free session