What does it mean?
A table, a coordinate pair and a graph can describe the same input–output relationship. A function assigns exactly one output to each input in its domain. Different inputs may share an output: x² gives the same result for 2 and −2 without breaking the function rule.
A relation can be shown as a story, a table, coordinates, or a graph. For the rule y = 2x + 1, each chosen x gives one y. The pair (x, y) is a point: x is the first number, y is the second. Plotting several points may produce a straight line. If the line does not pass through (0, 0), the relation is still valid. Direct proportion is a special case taught later. Read values from the table or the axes.
Learning goal: Connect a situation, table, coordinates and graph. The grade is a suggested starting point; school sequences vary. Use the first worked example to check readiness, and Number patterns: explain the rule if an earlier idea needs revisiting.
See the idea
Read each diagram with its labels, then follow the worked examples. Practice questions include their own measurements and information.
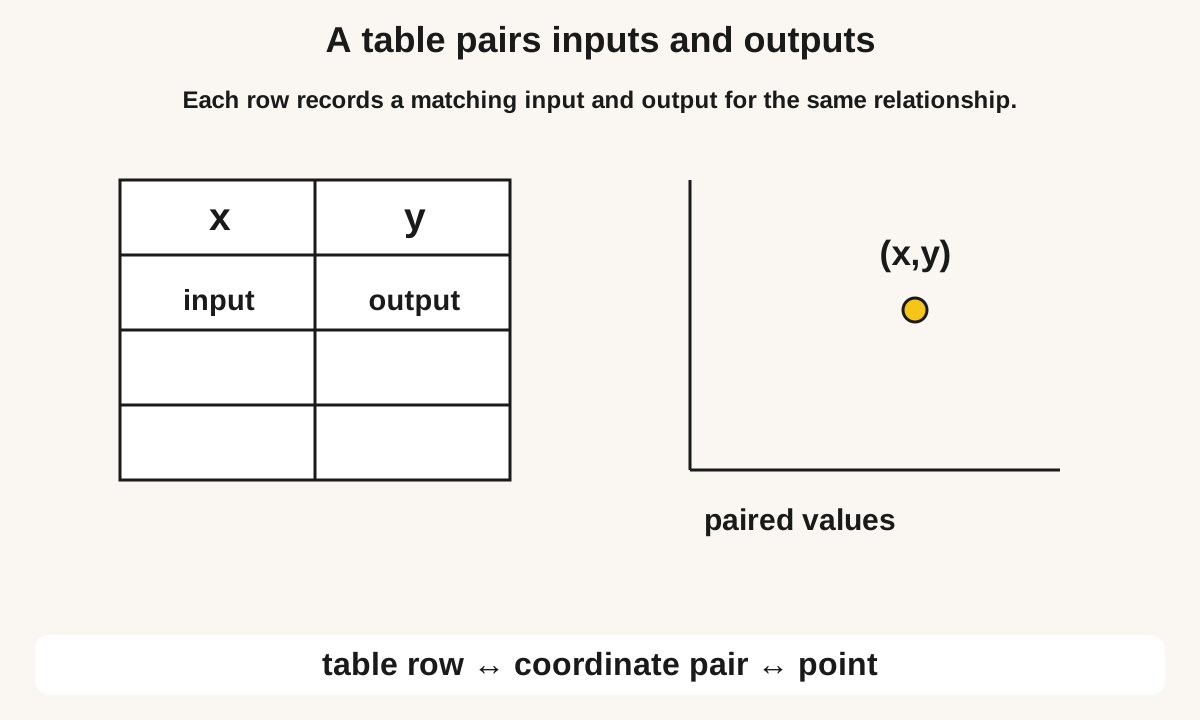
Enlarge diagram to read the labels
Swipe across the enlarged diagram to read every label.
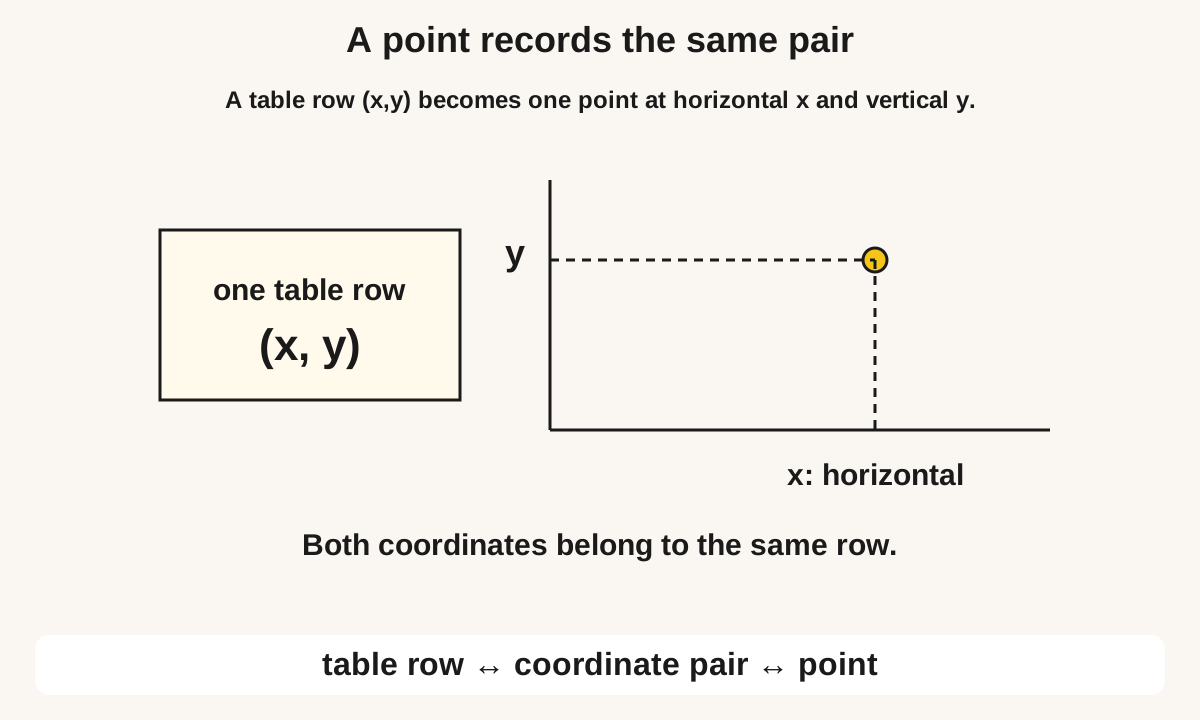
Enlarge diagram to read the labels
Swipe across the enlarged diagram to read every label.
Choose a method and explain why it works
Label the input and output columns and their units. Apply the rule to each input, keeping coordinate order (x, y). Plot the pairs using the axis scales. Only join points when intermediate inputs make sense for the model. A table of whole ticket counts may be discrete rather than a continuous physical line.
Notation: (3, 7) means x = 3 and y = 7. The origin is (0, 0).
Key rule and when to use it
A function assigns exactly one output to each allowed input. Several inputs may share an output; one input cannot have two outputs.
Worked examples, step by step
Example 1: For y = 2x + 1, make a table for x = 0, 1, 2 and plot the point for x = 2.
- When x = 0, y = 1. When x = 1, y = 3. When x = 2, y = 5.
- The point for x = 2 is (2, 5). x is 2, y is 5, not (5, 2).
- The point (0, 1) is not the origin, so the graph does not have to pass through (0, 0).
Answer: (2, 5)
Check: y is always 1 more than double x, so at x = 2, y = 5.
Example 2: A graph of y = x + 3 is a straight line. Does it represent the same relation as the table x: 1, 2, 3 with y: 4, 5, 6? Explain using a point that is not the origin.
- This question matches a table to a graph, rather than building a table from scratch.
- Check (1, 4): 1 + 3 = 4. Check (2, 5): 2 + 3 = 5. The table fits y = x + 3.
- The line meets the y-axis at 3, not at 0, so it is not forced to be direct proportion.
Answer: yes; (1, 4) fits y = x + 3
Check: Each y is 3 more than x.
Example 3: The table x: 1, 2, 3 and y: 5, 7, 9 follows y = 2x + 3. Is this a function?
- Each x appears once: 1, 2 and 3.
- Each has one y: 5, 7 and 9.
- Yes, it is a function. The rule assigns one output to each input.
Answer: yes
Check: No x is listed twice with two different y values.
Example 4: A mapping sends 2 → 5 and also 2 → 7, and sends 3 → 5. Is this a function?
- This mapping is not a single rule table. Input 2 has two outputs, 5 and 7.
- Input 3 has one output, which would be allowed on its own.
- Because 2 has two outputs, the mapping is not a function. Sharing the output 5 between 2 and 3 would have been allowed if 2 had only one arrow.
Answer: no
Check: A machine cannot return two different results for the same input at once.
Example 5: For y = x², find the outputs for x = −2, 0 and 2. Is this a function?
- The outputs are 4, 0 and 4.
- The pairs are (−2, 4), (0, 0) and (2, 4).
- It is a function because each listed input has one output. Sharing the output 4 is allowed.
Common mistakes and important boundaries
A few points can fit many possible rules. A table fitting y = 2x + 1 does not prove that every unobserved input follows that rule unless the question supplies or justifies the model. A straight line need not pass through the origin; that extra condition matters for direct proportion.
A point to explain
A learner may swap x and y, or assume every straight line must go through the origin.
Compare an uncertain attempt with the closest worked example. Look at the meaning of each operation, unit and label before repeating the arithmetic.
Function Tables and Graphs: Inputs and Outputs — practice
Work on paper first. Open each answer afterwards and compare the reasoning. Print the questions with or without the separate answer key; no account is required.
Name: ____________________ Date: __________
In the pair (4, 1), which number is the x-coordinate?
Answer and a way to check
4
The first number is x. The second number is y.
A point is plotted at x = 3, y = 2. Which pair names that point?
Answer and a way to check
(3, 2)
Read along the horizontal axis first, then the vertical axis.
For y = 3x − 1, find y when x = 2. Write the point.
Answer and a way to check
(2, 5)
Multiply 3 by 2, then subtract 1. Write (x, y).
A table has x = −2, −1, 0 and y = 1, 3, 5. What is y when x = −2?
Answer and a way to check
1
Find the column or row for x = −2. Read the y in that same pair.
The line y = x goes through (0, 0). The line y = x + 2 does not. Give one point on y = x + 2.
Answer and a way to check
(0, 2)
Put x = 0 into y = x + 2, or put x = 1. Write the pair.
A student says every straight-line graph must pass through (0, 0). Using y = 2x + 1, explain why that is false.
Answer and a way to check
When x = 0, y = 1, so the graph meets the y-axis at (0, 1), not at the origin.
Find y when x = 0. Is that point the origin?
A table shows (2, 5). A student plots (5, 2). What is the mistake?
Answer and a way to check
The student swapped the x-coordinate and the y-coordinate.
The first number in the pair goes along the x-axis.
A plant is 3 cm tall and grows 2 cm each day. Complete y = 2x + 3 for x = 0, 1, 2 days, then give the point for day 2.
Answer and a way to check
y = 3, 5, 7; (2, 7)
When x = 0 the height is 3. Each extra day adds 2. Write the pair for day 2 as (2, y).
Which sentence defines a function?
Answer and a way to check
Each input has exactly one output.
Look at one input. Count how many outputs leave it. A function allows only one.
A mapping shows 1 → 4, 2 → 4 and 3 → 6. Is it a function?
Answer and a way to check
Yes: each input has one output, even if outputs repeat.
Repeated outputs are allowed. Repeated inputs with different outputs are not.
The rule y = 5 − x. Find the output when the input is 2.
Answer and a way to check
3
Replace x with 2 in 5 − x.
A table lists (2, 5) and (2, 8). Is it a function? Answer yes or no.
Answer and a way to check
no
The input 2 is paired with two different outputs. That breaks the function rule.
Function Tables and Graphs: Inputs and Outputs — answer key
4 The first number is x. The second number is y.
(3, 2) Read along the horizontal axis first, then the vertical axis.
(2, 5) Multiply 3 by 2, then subtract 1. Write (x, y).
1 Find the column or row for x = −2. Read the y in that same pair.
(0, 2) Put x = 0 into y = x + 2, or put x = 1. Write the pair.
When x = 0, y = 1, so the graph meets the y-axis at (0, 1), not at the origin. Find y when x = 0. Is that point the origin?
The student swapped the x-coordinate and the y-coordinate. The first number in the pair goes along the x-axis.
y = 3, 5, 7; (2, 7) When x = 0 the height is 3. Each extra day adds 2. Write the pair for day 2 as (2, y).
Each input has exactly one output. Look at one input. Count how many outputs leave it. A function allows only one.
Yes: each input has one output, even if outputs repeat. Repeated outputs are allowed. Repeated inputs with different outputs are not.
3 Replace x with 2 in 5 − x.
no The input 2 is paired with two different outputs. That breaks the function rule.
Questions students and parents ask
Does a table prove that a rule is linear everywhere?
No. A finite table shows only the listed inputs. A stated rule such as y = 2x + 1 defines a straight line on its domain, but many other functions can agree at a few table entries.
Can a function have two outputs for the same input?
Not in the usual definition used here. If one input is assigned two different outputs in the stated relation, that relation is not a function.
Is this a complete set of textbook exercise solutions?
No. This guide adapts BananaLearn’s own teaching examples and practice. It is not official NCERT material or a promise of the exact chapter sequence in a particular board, country or textbook edition.
What if the examples are still difficult?
Revisit Number patterns: explain the rule. Try the first example with its model, then attempt one fresh question independently. A correct copied answer is not evidence that the method can be used without support.
Help at home
Ask what one row means in words. Then switch between that row, its coordinate pair and its plotted point before extending a pattern.
Keep one example of the learner’s own working. A repeated difficulty across fresh questions can guide a discussion with their teacher; one short practice sheet does not establish a diagnosis or a full mastery profile.
Connect this idea to the next skill
About this guide
Based on BananaLearn’s Grade 8 course lesson “Table, Points and Graph” and its related lesson “One Output Each Time”. The explanations have been adapted for independent reading; course diagrams are reused where they fit the idea, and missing classroom givens are made explicit in questions.
Need another way to understand it?
Bring one question your child found difficult to a free 50-minute session. Tell us their grade, curriculum and time zone so we can discuss a suitable next step.
Request a free session