Science · Suggested Class 7
Weather vs Climate: Class 7 Data, Examples & Practice
A cold Tuesday can happen in a place with a warm climate. One day describes the weather; a long record helps describe the range of conditions a place usually experiences.
Original BananaLearn guide · 2 November 2026
On a phone, swipe across the illustration to read every label.

The key distinction is the time scale
Weather describes atmospheric conditions over short periods at a place, including temperature, rain, cloud, wind and humidity. Climate describes the longer-term statistical pattern of weather, including averages, seasonal differences and variability. Climate is more than the hottest day someone remembers.
Thirty-year periods are commonly used for climate averages, but a climate description also considers patterns and ranges rather than only one mean. A weather forecast for tomorrow and a climate description for a region answer different questions. Neither makes an individual future day certain.
Use the same place, variable and unit
A fair data comparison names the location, dates, measurement and units. Daily maximum temperature is not the same quantity as the temperature at 9 a.m. Comparing one city’s daily maximum with another city’s night minimum can create a misleading impression even when both numbers are accurate.
Record rain in a consistent unit and time window as well. A statement such as rainfall was 10 needs a unit and a period. Ten millimetres in one day is a different observation from ten millimetres in an entire month. Define the column before using the figures in a conclusion.
Read a short fictional temperature record
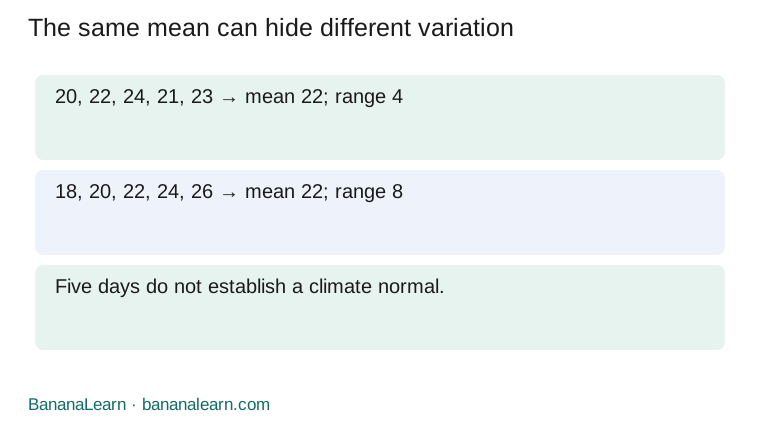
For an invented location, suppose five consecutive daily maximum temperatures are 20,22,24,21 and 23°C. Their sum is 110°C and the mean of the five numerical readings is 22°C. The range is 24−20=4°C. These are teaching numbers, not a real local forecast.
The mean describes these five readings. It is not the location’s climate normal. It also does not mean the temperature stayed at 22°C all day or that every day was identical. Two records can have the same mean but different variation, so look at the individual readings as well as a summary.
On a phone, swipe across the illustration to read every label.
Add a long-term comparison without mixing quantities
Imagine a clearly labelled long-term reference saying the average daily maximum for that location and month is 25°C. Compare the five-day mean of 22°C with that reference carefully: these particular five days were cooler than the reference average. The periods are very different, so the comparison does not by itself establish a lasting climate trend.
A multi-year trend needs a suitable consistent record and analysis, including changes in measurements and natural variability. This lesson teaches interpretation, not a calculation of an actual city’s changing climate. Do not present the fictional 25°C reference as an official climate normal.
Seasons and places make the comparison more specific
A warm month and a cool month at one location can have different typical conditions. Comparing July in one hemisphere with July in another may compare different seasons. Altitude, distance from the sea and other geographical factors can also influence a place’s climate.
A regional climate description still allows local variation. A shaded courtyard and an exposed paved area can feel different on the same day. Do not use one playground reading to replace a properly defined regional measurement. Name the scale of the claim: a spot, a town, a region or the globe.
Avoid the one-day proof mistake
It snowed today, so a long-term warming trend cannot exist is not a valid inference. A short-term cold event and a long-term change can coexist. Similarly, one unusually hot afternoon alone does not quantify a global climate trend. Match the evidence’s time and place to the claim.
This does not mean daily events are irrelevant. They matter for immediate decisions and can be included in longer records. The mistake is asking one observation to prove something that requires a much broader, consistent dataset.
An original paper-data activity
Plot the five fictional temperatures on a labelled line graph with Day 1 to Day 5 on the horizontal axis and daily maximum temperature in °C on the vertical axis. Mark each reading, calculate the mean and write one supported statement and one unsupported statement.
Supported: Day 3 had the highest reading in this five-day set. Unsupported: The location’s climate is cooling. For an extension, change the readings to 18,20,22,24,26°C. The mean stays 22°C but the range becomes 8°C, demonstrating why an average alone does not describe all variation.
Check an explanation before sharing it
Ask Which variable? Which location? Which dates? Which units? How much data? Does the conclusion stay within those boundaries? A well-labelled small graph can teach more than a dramatic caption attached to unidentified numbers.
Use official weather or climate information for actual travel or safety decisions rather than these invented values. The practice below is about school-level data reasoning. Class placement is suggested, and no country-specific weather forecast or current climate statistic is being supplied.
A data-claim checking record
Copy this record into a notebook. Fill each blank using your own example or the activity above.
On a phone, swipe across a wide table to see every column.
| Check | Write before concluding |
|---|---|
| Place and dates | ___ |
| Variable and unit | ___ |
| Short or long record? | ___ |
| Average and variation | ___ |
| Supported claim | ___ |
| What the data cannot show | ___ |
12 questions with explained answers
Try each question first. Open the explanation to check your reasoning. These are original BananaLearn questions, not official exam questions.
Is tomorrow’s rain forecast weather or a climate description?
Check answer and reasoning
Weather.
It concerns short-term conditions.Is a region’s long-term seasonal rainfall pattern weather or climate?
Check answer and reasoning
Climate.
It summarises a longer statistical pattern.Find the mean of 20,22,24,21,23.
Check answer and reasoning
22
The sum is 110 and 110÷5=22.Find the range of those five temperatures.
Check answer and reasoning
4°C
24−20=4.Does that mean establish a climate normal?
Check answer and reasoning
No.
It represents only five daily readings.What is missing from Rainfall was 10?
Check answer and reasoning
A unit and a time period, and usually a location.
The value cannot be interpreted reliably without its measurement context.Can a warm climate have a cold day?
Check answer and reasoning
Yes.
Long-term patterns include short-term variation.Is daily maximum temperature the same as a 9 a.m. reading?
Check answer and reasoning
No.
They are different measurement definitions.Find the mean of 18,20,22,24,26.
Check answer and reasoning
22
The sum is again 110.Find that second record’s range.
Check answer and reasoning
8°C
26−18=8, even though the mean is unchanged.Does one hot afternoon quantify a global climate trend?
Check answer and reasoning
No.
The scope and time span of the evidence are insufficient.Name a supported statement about the first fictional record.
Check answer and reasoning
Day 3 has its highest maximum, 24°C.
This claim stays within the five-day dataset.
Choose your next learning step
Explore BananaLearn games, learning resources and tutoring. Maths is our priority; English and Science tutoring are also available. Share your current schoolwork when checking teaching fit.
Sources and scope
Explanations, activities, diagrams and practice are original BananaLearn work. Class labels suggest a learning level; school sequences and current textbook editions can differ. Sources checked 2 November 2026.
How we prepare guides · Report a correction
Share the complete guide: https://bananalearn.com/learn/class-7-weather-climate-difference.html