Maths · Suggested Grade 10
Median of Grouped Data: Class 10 Formula & Examples
The median class contains the middle of the data; it is not necessarily the class with the most observations. Cumulative frequency tells you where to look.
Original explanations and practice by BananaLearn · Published 1 November 2026
On a small screen, swipe across the illustration to read every label.
Why grouped data gives an estimate
For a raw ordered list, the median is its middle value, or the average of the two middle values. A grouped table hides the individual values inside intervals. We can locate the middle region and estimate within it, but generally cannot recover the exact raw-data median.
The usual school formula assumes an even spread within the median class. That is an approximation, not a fact proved by the table. We use continuous non-overlapping classes, with a lower endpoint included and the upper endpoint excluded except where a stated convention differs.
Worked table and cumulative frequency
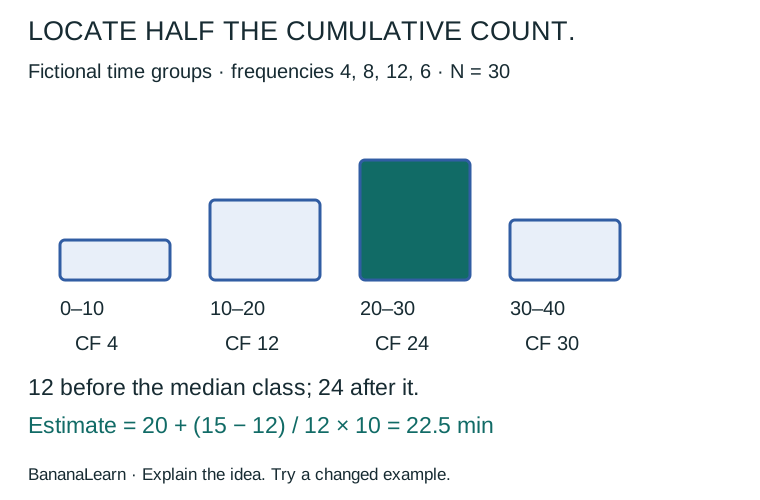
Consider fictional completion times: 0–10 minutes has frequency 4; 10–20 has 8; 20–30 has 12; 30–40 has 6. The total N is 30. Cumulative frequencies are 4, 12, 24 and 30. They count all observations below each successive upper boundary.
N/2 = 15. The cumulative count is 12 before the 20–30 class and 24 after it, so the middle lies in 20–30. The largest frequency also happens to be there in this example, but that coincidence is not the method. A different table can have different modal and median classes.
Read every symbol in the formula
Estimated median = l + [(N/2 − F)/f] × h. Here l is the lower boundary of the median class, F is cumulative frequency before that class, f is its own frequency, and h is its width. For our table: l = 20, F = 12, f = 12 and h = 10.
Substitute: 20 + [(15 − 12)/12] × 10 = 20 + 2.5 = 22.5 minutes. The fraction 3/12 tells how far through the median class to interpolate. Dividing by cumulative frequency 24 would use the wrong quantity.
A second example separates median from mode
Take classes 0–10, 10–20, 20–30, 30–40 with frequencies 9, 4, 5, 2. N = 20 and cumulative frequencies are 9, 13, 18, 20. The modal class is 0–10 because frequency 9 is greatest. The median lies in 10–20 because the middle target is 10.
The estimate is 10 + [(10 − 9)/4] × 10 = 12.5. Using the class with the tallest frequency would incorrectly place it in 0–10. Keep the questions Which class is most frequent? and Where is half the cumulative count? separate.
Class boundaries and the halfway boundary case
If ages recorded in completed whole years are grouped 10–14, 15–19 and 20–24, a continuous-boundary convention may use 9.5–14.5, 14.5–19.5 and 19.5–24.5 when appropriate to the measurement and task. Do not blindly change boundaries for every table; read how values were measured and grouped.
If cumulative frequency equals N/2 exactly at a boundary, interpolation gives that shared boundary. For frequencies 5, 5, 10 in 0–10, 10–20, 20–30, N/2 = 10 and the estimate is 20. Using the preceding class to its end or the next class at its start gives the same boundary estimate. It still does not recover the exact raw-data median.
Check the estimate and its units
The estimate should lie inside the selected class or on a shared boundary. In the first example 22.5 lies between 20 and 30, which is plausible. An answer of 42.5 would signal a wrong base, width or cumulative count. Express completion-time medians in minutes; a frequency is a number of observations, not a time.
If a frequency is missing, use a supplied total first. For frequencies 4, x, 12, 6 and total 30, x = 8. Only then build the cumulative column and find the median. Guessing the median class before the frequency is known can be misleading.
From procedure to explanation
Use the record to state the total, halfway target, median class and four formula inputs before calculating. Explain the estimate as starting at the lower boundary and moving a fraction of the class width. This connects the formula to a cumulative-frequency model.
Parents can ask why the answer is an estimate and why f is not the total frequency. If a learner can identify the class but cannot explain interpolation, use a simple line from 20 to 30 and mark one quarter of its length. That is the movement from 20 to 22.5 in the worked example.
Cumulative-frequency working table
Use this reference while checking an explanation or solving a related question.
| Minutes | Frequency f | Cumulative frequency |
|---|---|---|
| 0–10 | 4 | 4 |
| 10–20 | 8 | 12 |
| 20–30 | 12 | 24 |
| 30–40 | 6 | 30 |
12 questions with explained answers
Try the questions before opening the answers. Explain the reason, then try a changed example to check your understanding.
Frequencies 4, 8, 12, 6: total N?
Show answer and explanation
30
Sum all frequencies.Their cumulative frequencies?
Show answer and explanation
4, 12, 24, 30
Add each class to the preceding total.For N = 30, what is N/2?
Show answer and explanation
15
This locates the middle region.For that table, median class?
Show answer and explanation
20–30
Cumulative count passes 15 in that class.What is F for that median class?
Show answer and explanation
12
Use cumulative frequency before the class.What is f for that median class?
Show answer and explanation
12
Use its individual frequency, not cumulative 24.Estimate its median with width 10.
Show answer and explanation
22.5
20 + (15 − 12)/12 × 10.Frequencies 9, 4, 5, 2: modal class?
Show answer and explanation
0–10
It has the greatest individual frequency.For the same table, median class and estimate?
Show answer and explanation
10–20; 12.5
N/2 = 10; cumulative counts 9 then 13.Frequencies 5, 5, 10 in three width-10 classes starting at zero: estimate?
Show answer and explanation
20
The halfway cumulative count lands at the shared boundary.Frequencies 4, x, 12, 6 sum to 30. Find x.
Show answer and explanation
8
30 − 4 − 12 − 6.Is the grouped estimate necessarily the exact median of the original list?
Show answer and explanation
No
The individual values within the classes are hidden.
Keep the ideas connected
For help with a school-learning difficulty, bring one attempted question to a discussion about tutoring and curriculum fit. Maths is our priority; English and Science tutoring are also available.
Sources, scope and sharing
The examples, diagrams and practice are original BananaLearn work. Grade labels suggest a learning level; teaching sequences and school requirements can differ. Official sources below support the stated facts and resource links. These activities are independent resources, not official exam questions or endorsed campaign materials.
How we prepare learning guides · Report a correction
Share this guide: https://bananalearn.com/learn/class-10-median-grouped-data.html