1. Find the fictional total at 20 m/s.
- Thinking: 20×1=20 m.
- Braking: 0.05×20²=20 m.
- Total: 20+20=40 m.
Maths · Suggested Classes 6–8
Double the speed in a model and the stopping distance need not simply double. Separate what happens before braking from what happens during braking.
Start here
UK Road Safety Week 2026 is 15–21 November. This paper-only maths activity uses a fictional model to compare thinking, braking and total stopping distances.
Original BananaLearn guide · 7 November 2026
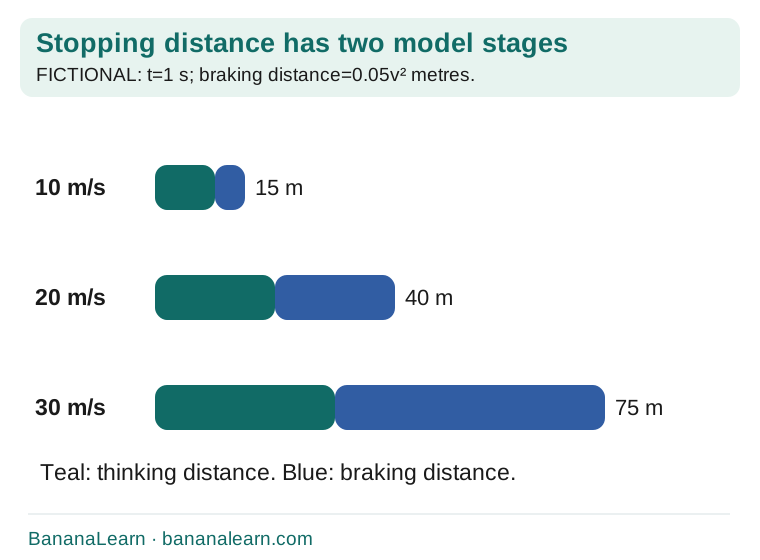
On a narrow screen, swipe the diagram or open it full size.
Brake’s UK Road Safety Week runs from 15 to 21 November 2026. This is an independent BananaLearn learning activity, not Brake’s official action pack. Use the organiser’s site for campaign materials and current messages.
The calculations below are fictional teaching values, not official stopping-distance guidance or predictions for a real vehicle. Complete the task with paper, diagrams and supplied data; no live-road experiment is part of it.
Thinking distance is distance travelled during the model’s reaction interval before braking begins. Braking distance is distance travelled during braking until rest. Total stopping distance is their sum.
A diagram should begin both bars at the same starting reference and show the stage boundary. “The brakes act instantly” would remove the first stage and change the model.
Let speed v be in metres per second. Assume reaction interval t=1 second and fictional braking rule b=0.05v² metres. Thinking distance is vt=v metres, so total d=v+0.05v².
These assumptions are chosen for arithmetic and comparison. Real stopping depends on many conditions, including reaction, road surface, tyres, brakes and gradient. Do not use the model to decide whether a real road situation is safe.
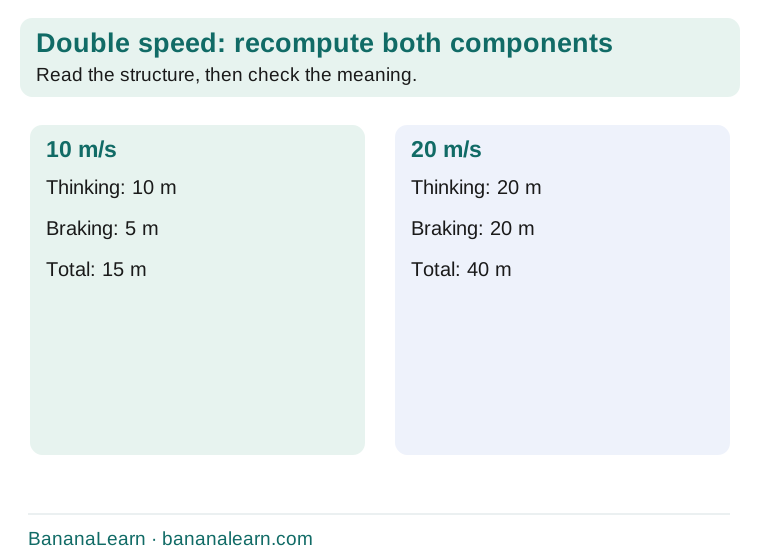
On a narrow screen, swipe the diagram or open it full size.
At v=10 m/s, thinking distance is 10 m, braking distance 5 m and total 15 m. At 20 m/s, they are 20,20 and 40 m. At 30 m/s, they are 30,45 and 75 m.
Label every column and keep the squared speed in brackets before multiplying. The totals are sums of distances; a speed value cannot be added directly to a distance without using the model’s time and coefficient units.
Doubling v doubles vt when the reaction interval stays fixed. In the braking rule, (2v)²=4v², so braking distance quadruples. Total distance combines these two changes.
From 10 to 20 m/s, total distance rises from 15 to 40 m: a factor of 8/3, not 2 or 4. Do not apply the braking factor to the total without recalculating both parts.
Keep v=20 m/s and change the model reaction interval from 1 to 1.5 seconds. Thinking distance becomes 30 m; braking remains 20 m; total becomes 50 m.
This comparison isolates the reaction interval. If speed and braking coefficient also changed, you could still calculate the new total, but you could not attribute its whole increase to one factor.
Use one scale for all distances and a consistent colour or pattern for each stage. A 75 m total bar must be five times the length of a 15 m total bar. Put the units and “fictional model” beside the chart.
A drawing of a car is a visual cue, not a scale vehicle. Avoid stretching an illustration to suggest a measurement. The stacked distance bars carry the quantitative information.
Complete: “Under this model, increasing speed from ___ to ___ changes thinking distance from ___ to ___ and braking distance from ___ to ___. Therefore the total changes from ___ to ___.”
Then state one limitation. The activity’s useful outcome is explaining a non-linear relationship and reading a model honestly. It does not supply personal driving advice, legal requirements or a certified safe distance.
See the reasoning
Try, explain, check
Try each task before opening its explanation. These are original BananaLearn questions, not official exam or past-paper questions. Where several answers can work, the explanation gives the criteria.
15–21 November 2026
The organiser confirms those dates.
No
Its values come from a stated fictional classroom model.
10 m
vt=10×1.
5 m
0.05×10²=5.
15 m
10+5.
75 m
30+0.05×900.
It quadruples
The speed is squared.
No
The thinking component changes linearly.
10 m
20×0.5=10.
For example: a shared distance scale and clearly labelled stage segments
The visual must preserve quantitative comparisons.
For example: road surface, gradient or tyre condition
Actual conditions affect stopping behaviour.
No
It is a paper-and-supplied-data task.
Copy these headings and fill them for one worked task, then for a fresh attempt. Use your own evidence rather than copying the model answer.
Explore BananaLearn’s games, learning features and one-to-one tutoring. Maths is our priority; English and Science tutoring are also available. Bring a recent example of schoolwork when checking teaching fit.
Original BananaLearn explanations, examples, illustrations and practice. Source facts checked 7 November 2026. Suggested levels are learning guides, not a claim that every board or textbook uses the same sequence.
Event timing is calendar-backed. Search demand is a forecast unless a separately measured trend is stated. No official event theme, school programme or affiliation is implied.
How we prepare guides · Report a correction
Share the complete guide: https://bananalearn.com/learn/road-safety-week-2026-stopping-distance.html