
Start with the key idea
An analytical paragraph explains the main patterns in supplied information, supporting comparisons with accurate evidence. Identify the data, state an overview, develop the most meaningful comparisons and avoid causes or conclusions the source cannot support.
1. Read the source before writing an opinion
Begin with the title, labels, units, sample size and time period. A chart of preferred formats is different from a chart of hours spent reading. Counts of students are not automatically percentages unless the total supports that conversion. Check whether each person could choose one option or several.

The original practice chart here shows a fictional survey of 100 students, with one choice each: print books 45, e-books 35 and audiobooks 20. These are invented teaching data, not claims about students generally. The source provides preferences but no reasons for them.
Write a brief identification sentence before interpreting the figures. It should tell the reader what the chart measures and whose data it represents. Do not add a school, year or country that the source does not supply.
2. Choose the most important pattern
An overview identifies the main relationship rather than listing every figure. Here, print is the largest single category and audio is the smallest. E-books and audio together account for more students than print, so the source also supports a useful combined comparison.
Avoid calling print a majority. It has 45%, which is below half, even though it leads the other individual categories. “Largest share” and “majority” are not synonyms. Likewise, “twice as many” requires an exact or clearly qualified ratio, not merely a visible difference in bar height.
Select comparisons that answer the task. A paragraph with three isolated sentences repeating the chart labels contains data but little analysis. Explain relationships such as difference, ranking, combined share or change over time where the source permits them.
3. Check differences, percentages and ratios
The difference between print and e-book preferences is 45 − 35 = 10 students. Because the total is 100, this is also a 10-percentage-point difference in shares. It is not a 10% relative increase from 35; that would use a different calculation and reference value.
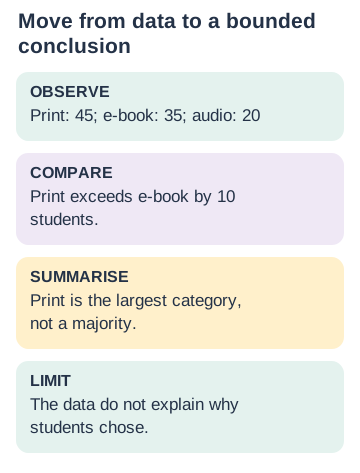
E-book and audio preferences total 35 + 20 = 55 students, or 55% of this sample. Audio is 20/100 = 20%. If the survey had 200 students and 20 chose audio, the share would be 10%, showing why the denominator matters.
Use only calculations that help the explanation and can be checked. Do not crowd a short paragraph with every possible ratio. Keep units visible, round only when appropriate, and distinguish exact values from estimates read from an imprecise chart.
4. Read the complete model paragraph
The chart presents preferred reading formats in a fictional survey of 100 students, each choosing one option. Print books form the largest category at 45 students, followed by e-books at 35, while audiobooks account for the remaining 20. Print therefore leads e-books by 10 students and exceeds audio by 25. However, it does not attract a majority on its own: the two non-print formats together represent 55% of the sample. Overall, the results show a leading individual preference for print alongside a substantial combined preference for digital and audio formats. The chart describes choices within this sample but does not explain the reasons behind them.
The model identifies the source, gives an overview, supports comparisons and states a limitation. It does not claim that print improves learning, that audio is unpopular everywhere or that screens caused the pattern. Those claims would need different evidence.
The paragraph is one connected explanation rather than a bullet list. Follow the specific task’s required length and format; do not assume every analytical paragraph uses the same sentence count.
5. Separate evidence, inference and unsupported causes
A chart can show that two quantities differ without explaining why. “More students chose print than audio” is directly supported here. “Students chose print because their parents banned phones” is invented. A plausible cause is still unsupported when the source contains no evidence about it.
Use cautious wording for limited conclusions. “In this sample” prevents an unjustified claim about all students. If a line graph shows a rise over several years, describe the rise accurately, but do not attribute it to a policy unless the source supports that connection.
Data quality also affects confidence. A tiny or non-representative sample may not support broad generalisation. In a school writing task, you usually do not need a long methodological critique, but a concise limitation can keep the conclusion proportionate to the evidence.
6. Edit for logical flow and numerical accuracy
Organise the paragraph as source identification, overview, selected evidence and a bounded conclusion. Link related comparisons with words such as while, whereas, however and overall, but use them only when the relationship fits. A contrast word should introduce a real contrast.
Audit every number against the source and every comparative word against arithmetic. Check highest, lowest, majority, doubled, increased and decreased especially carefully. A chart without a time axis cannot show an increase merely because one bar is taller than another; it may simply compare categories.
Finally remove personal preference and repeated data. “I love printed books” belongs in a personal response, not an objective analysis of the survey. Read the final paragraph to ensure it says something coherent about the evidence while staying within what the evidence can establish.
5 worked examples with reasoning
1. Is print a majority choice in the sample?
- Print has 45 of 100 choices.
- A majority requires more than 50.
- It is the largest category, not a majority.
2. Find the difference between print and e-book counts.
- Subtract 35 from 45.
- The difference is 10 students.
- Because the total is 100, the shares differ by 10 percentage points.
3. Combine the non-print categories.
- Add e-book 35 and audio 20.
- The total is 55 of 100.
- The combined non-print share is 55%.
4. Repair: Audio is low because students dislike listening.
- The source gives choices but no reasons.
- Remove the invented cause.
- Audio is the smallest category at 20 students.
5. Can the chart prove a trend over time?
- There is no sequence of dates in the source.
- The bars compare categories in one survey.
- Describe differences, not an increase or decline over time.
Save the guide or print the practice
Download to save or share
Complete guide with answers (PDF) · Worksheet without answers (PDF) · Worksheet and answer key (PDF)
Try each task before opening its answer. Give an example or reason, not only a label.
14 practice questions with explanations
Try each task before opening its answer. Give an example or reason, not only a label.
Write an answer and your reason before opening the explanation. Check the reasoning as well as the final answer.
- Source
How many students are in the fictional survey?
Answer and reasoning
100.
The source specifies the sample size.
- Choice
How many options could each student choose?
Answer and reasoning
One.
This makes the counts sum to the sample total.
- Largest
Which category is largest?
Answer and reasoning
Print, with 45 students.
Largest does not necessarily mean majority.
- Smallest
Which category is smallest?
Answer and reasoning
Audio, with 20 students.
Compare the three counts.
- Difference
How many more chose print than audio?
Answer and reasoning
25 students.
45 − 20 = 25.
- Combined
How many chose e-book or audio?
Answer and reasoning
55 students.
35 + 20 = 55.
- Share
What percentage chose audio?
Answer and reasoning
20%.
20 out of 100.
- Majority
Is 45% a majority?
Answer and reasoning
No.
A majority is more than half.
- Units
Do the bars show hours of reading?
Answer and reasoning
No.
They show numbers of students choosing formats.
- Reason
Does the chart explain why print was chosen?
Answer and reasoning
No.
Reasons were not collected.
- Trend
Can you call the taller print bar an increase over time?
Answer and reasoning
No.
The chart compares categories, not dates.
- Generalise
Can the sample establish every student’s preference?
Answer and reasoning
No.
Limit the conclusion to the supplied evidence.
- Language
Replace “Print is the majority” accurately.
Answer and reasoning
Print is the largest single category.
This preserves the correct comparison.
- Review
What should be checked besides the copied numbers?
Answer and reasoning
Comparative words, units and unsupported conclusions.
Accurate analysis depends on all of them.
Use the ideas without looking at the notes
Write a new paragraph from the same chart without copying the model. Underline one overview, two accurate comparisons and one appropriate limitation. Check every number and comparison word against the source.
Common questions
Is an analytical paragraph a personal opinion?
No. It explains supplied evidence using accurate comparisons.
Should I mention every value?
Include enough evidence for the main patterns; avoid unnecessary repetition.
What is the difference between percent and percentage points?
Percentage points compare percentage values directly; relative percent change uses a reference value.
Can I explain causes not shown in the data?
Do not present guessed causes as facts.
Must I use exactly the model’s length?
No. Follow the actual task’s word limit and required format.
Connect your learning
Ask about guided English learning if your child needs help explaining these ideas.
About this guide
Original explanations, examples, diagrams and practice by BananaLearn. The grade label indicates the intended learning level; this is not an official textbook extract or exam paper.